Expt 10) Antiferromagnetism — the original “hidden order”

Ferromagnetism is a state of matter whose existence has been known for millennia (Fe3O4 supposedly was the first known permanent magnet, but is actually a ferrimagnet). Coincidentally, it was also the material that took center stage in Expt 8 in this series of posts. Antiferromagnetism is, in some sense, “hidden order”. Although predicted in 1932 by Louis Neel, it was not apparent how to convincingly demonstrate that spins could align antiparallel to one another when the magnetic moments perfectly cancel. There is no net magnetization to speak of or measure!

Suggestions of a such a state were hinted at through the observation of a phase transition in magnetic susceptibility measurements, but the origin of such a phase transition was unclear. In 1949, Clifford Shull and J. Stuart Smart definitively demonstrated that antiferromagnetism was present in MnO. In their experiment, which used the new technique of neutron diffraction, magnetic peaks suddenly showed up below T_N, which indicated a doubling of the unit cell. Thus, the question of “hidden order” was finally settled — the evidence for antiferromagnetism was almost indisputable! The original paper, surprisingly and explicitly, states that it was Smart’s idea to use neutron diffraction to detect antiferromagnetism. Below is the original plot from MnO, taken from here, showing at least three peaks corresponding to the antiferromagnetism:

Expt 9) Soft phonons at continuous structural phase transitions

That continuous structural phase transitions are associated with soft phonon modes was first put forth theoretically by Cochran in 1959-60. He posited that as an optical phonon branch reaches zero frequency the material must become structurally unstable. Qualitatively, when the phonon frequency goes to zero, that mode becomes macroscopically occupied, which ushers in a structural change. The symmetry of the phonon determines the new low temperature structure.

While this theory was tested soon thereafter by many, a soft phonon associated with a structural instability had already been observed by Raman and Nedungadi nineteen years prior. In 1940, they saw that the transition between \alpha-quartz and \beta-quartz at 573C was associated with a soft phonon using (you guessed it!) Raman spectroscopy. However, it is important to note that the \alpha-\beta transition in quartz is a discontinuous phase transition. So while the phonon does soften considerably, it does not actually reach zero frequency before the structural transition takes place.

Below is the original image, showing the rather spectacular result, where the arrow indicates the phonon that softens significantly upon approaching the transition temperature (it starts out at at ~220 cm-1). Both the Stokes and anti-Stokes softening can be observed due to the high temperature of the studies.

Phonon softening in quartz. As the temperature is raised, a phonon that starts out at the position of the arrow shifts toward lower frequency (i.e. towards the region of large intensity Rayleigh scattering). (The phonon mode, for some reason, is barely visible in the -192C spectrum.) At high temperatures, the phonon linewidth broadens considerably and is very difficult to see at 530C. It is actually easier to see the softening on the anti-Stokes side (towards the left of the Rayleigh scattering).

Expt 8) Metal-insulator transitions

Prior to 1939, the Bloch-Wilson rule for predicting whether a given material would be an insulator or a metal reigned supreme. However, all was not well as early as 1937. De Boer and Verwey, in a famous paper, pointed out that 3d electron systems like NiO are orders of magnitude less conductive (about a factor of 1010 less!) than expected by the simple Wilson counting rule. In a short monograph, Peierls and Mott shared some of their ideas on the paper by de Boer and Verwey, which is a very interesting read because of the authors’ qualitative reasoning. The Mott/Peierls discussion is very representative of how physics is actually done. Most notably, they speculated on the role of the electron-electron Coulomb interaction despite others raising the possibility that the potential barriers between electrons were larger for some reason in 3d compounds. Only years later were the rather vague Mott/Peierls ideas made more quantitative.

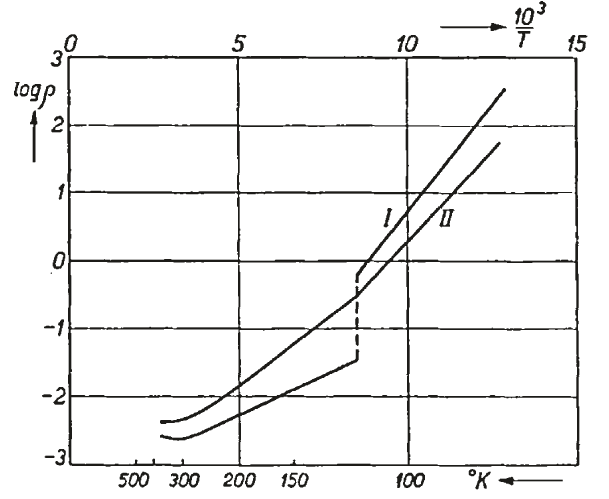
Among the “anomalous” insulators discovered by de Boer and Verwey, Fe3O4 was unusual; it remained metallic despite belonging to the class of atypical 3d insulators. From the Bloch-Wilson perspective, though, Fe3O4 was a “normal” metal. Just two years later, in 1939, this sense of normalcy was shattered. Verwey demonstrated that Fe3O4 undergoes a transition from a high temperature metal to a low temperature insulator at 120K. The transition is evidenced in the resistivity plot below. It should be noted that magnetic and structural discontinuities are also observed at the same temperature. This work opened up the study of metal-insulator transitions as well as materials we refer to today as strongly correlated electron systems. It could no longer be that the barriers between the electrons were anomalously high in these 3d insulators — a new physical concept was needed. These kinds of problems remain largely unsolved today, though much progress has been made. It is from these kinds of correlated insulators that many years later, we would eventually get cuprate superconductivity. The metal-insulator problem would re-emerge with renewed ferocity.

This image has an empty alt attribute; its file name is verwey.png
Log(\rho) vs 1/T in Fe3O4 with different phase fractions of Fe2O3. When the concentration of Fe2O3 is high, the resistivity no longer exhibits a discontinuity. Image taken from here.

Expt 7) Resistance minimum and Kondo effect

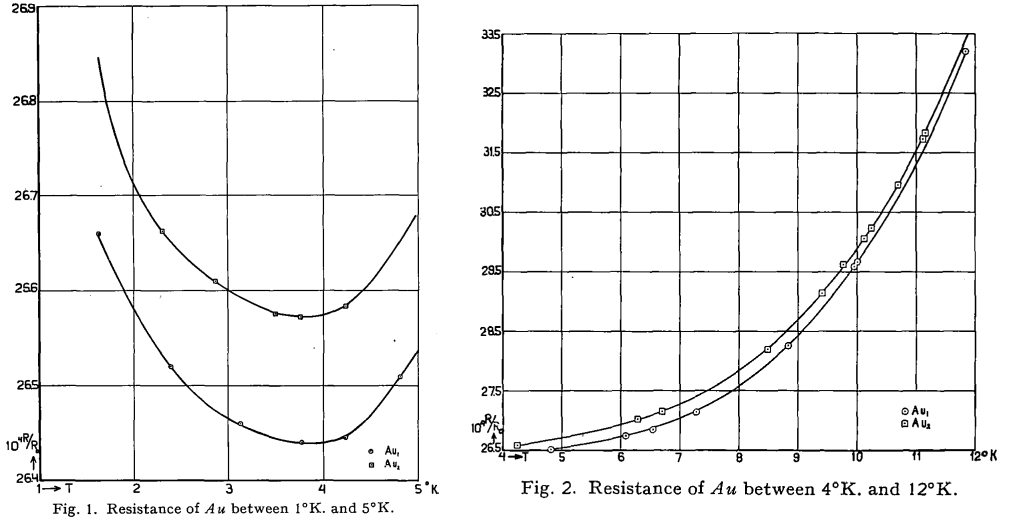
In 1934, de Haas, de Boer and van den Berg showed that the low temperature resistance of “not very pure” gold exhibited a rather peculiar feature. There existed a minimum in the resistance as temperature was reduced. Below are two figures showing the resistance of as a function of temperature in the range from 1-5 K and from 4-12 K:

In normal metals, like gold, it was thought that as temperature decreased, one would always observe a decrease in resistance due to reduced phonon scattering and then a plateau at low temperatures due to the presence of impurities. It was thus surprising that in gold, and subsequently many other metals, the resistance possessed a minimum and then started to increase at lower temperatures. Understanding of this phenomenon, now known as the Kondo effect, took the combined effort of many physicists.

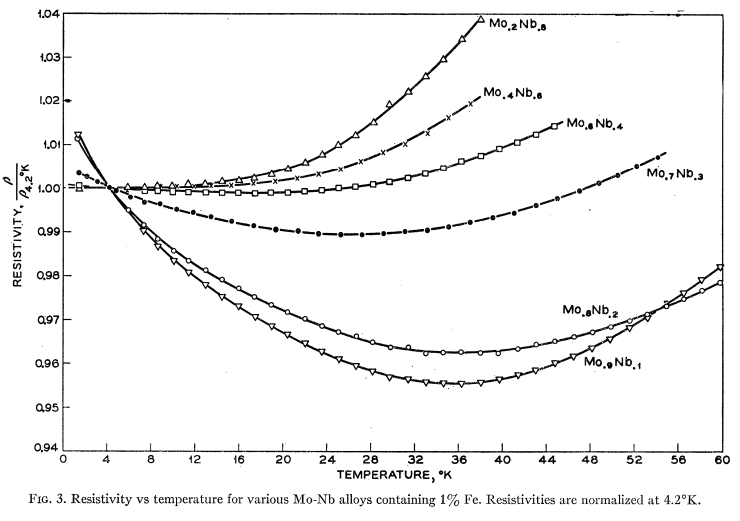
About 30 years after the initial discovery, material purity could be controlled to systematically investigate the effect of magnetic impurities on the resistance minimum. Clogston, Matthias and colleagues in 1961 showed that 1% of iron dissolved in a Nb-Mo alloy exhibited a Curie-Weiss susceptibility at low temperatures, which provided strong evidence of local moments. Then, in 1964, Sarachik and colleagues demonstrated that this 1% dissolution of Fe in Nb-Mo alloys systematically led to a resistance minimum. Below is the famous plot from Sarachik’s paper showing the resistance minimum as the Nb-Mo ratio was varied. When the susceptibility showed local moment formation, a minimum in the resistance developed:

A theoretical breakthrough was made in 1964 when J. Kondo used perturbation theory to analyze the s-d model developed by P.W. Anderson to show that a resistance minimum can arise due to the scattering of conduction electrons from magnetic impurities. However, only with the advent of the renormalization group was the problem fully solved by Wilson in 1975, as Kondo’s solution gave an unphysical logarithmic divergence in the resistance at low temperatures. It took more than 40 years to solve this seemingly innocent problem, which still continues to be of interest today in the context of heavy fermion superconductors and quantum dots.

Expt 6) Superfluidity in 4He

In 1938, Pyotr Kapitza and, independently, John F. Allen and Don Misener demonstrated that on cooling below the “lambda temperature”, the viscosity of liquid 4He suddenly reduced by orders of magnitude. Kaptiza coined the name “superfluidity” in his famous paper, where he also presciently compared superfluidity to superconductivity.

He used a rather ingenious experimental setup where the liquid flowed between two disks spaced about half a micron apart. By showing that the liquid helium in the superfluid phase flowed easily, while that in the normal phase did not, he estimated that the viscosity drops by about a factor of 1500. Strikingly, there is no data in the paper, but only a diagram of the apparatus he used to measure the viscosity (and to ensure that the flow of the liquid was laminar). Allen and Misener also published similar results, but their upper bound for the viscosity was orders of magnitude higher than Kapitza’s. They used flow through narrow capillaries to estimate the viscosity. While these results were quite definitive, it is worth remembering that experiments prior to these two had already shown a quite large drop in the viscosity on entering the superfluid state but with less spectacular results, presumably due to more turbulent flow. In these experiments, the researchers tried their best to ensure that the flow was largely laminar.

Below is a video showing a few of the dramatic effects in superfluid 4He.